Basic Biostatistics Definitions
By: Mohamed Hamed MD, Jonathan Kahan MD
What you need to know
We included this very brief section to explain some of the different statistics seen in research papers in a very basic way. This is how you will know the effect size of a particular treatment or be able to evaluate the data yourself. This is not an exhaustive list and it can get quite complicated.
Randomized controlled trial (RCT)
Trials that actively randomize participants into groups to compare different treatments or interventions.
For example: study randomize patients with coronary artery disease into a group receiving statins or a control group which are not receiving statins (who may be receiving a placebo= an inactive substance that looks like the same as an active drug). The effect of statins on the outcomes including death and new heart attacks is then followed.
Cohort study
Trials that follow a group of people with a common characteristic over time (usually years). Some of the cohort will be exposed to a specific risk factor then outcomes are compared.
For example: study comparing two groups of men, one who smokes and one who does not smoke, to see which cohort are more likely to develop lung cancer.
Cross sectional study
It is an observational study that analyzes data from a certain population at a certain point of time.
For example: measuring the prevalence or incidence of breast cancer in the year 2022 in the United States.
Median
It is the central number of a data set. For example, in the data set of 1,2,5,6 and 7 the median is 5.
Mean
It is the average value of the data set. For example, in the data set 1,2,5,6 and 7 (1+2+5+6+7=15, 21/5 = 4.2) the average is 4.2.
Incidence
It is the rate or occurrence of new events in a certain population over a specific period of time. For example, the incidence of people in the United States who have a heart attack per year is about 805,000 people/year.
Prevalence
It is the proportion of a certain population that is affected by a certain condition at a specific time. For example, the prevalence of coronary heart disease in the United States in 2022 is about 20.5 million people.
Odds ratio (OR)
It is a measure of how strongly an event is associated with exposure.
For example: Odds ratio is 20 for smoking causing lung cancer. This means that hypothetically a smoker has 20 times the odds of having lung cancer.
Relative risk (RR)
It is the probability of an outcome in an exposed group to the probability of an outcome in an unexposed group.
For example: If relative risk is 18, this means that smokers are 18 times likely to develop lung cancer than non-smokers.
Absolute risk reduction (ARR)
The probability or chance of an event will occur.
For example: A 36-year-old female with no risk factors has an absolute risk around 13% of developing breast cancer over her lifetime .
Relative risk reduction (RRR)
It measures the percentage decrease in the risk of adverse event in a certain group that receives an intervention compared to a control group that does not.
For example: say the risk of patients having a heart attack is 10 per 100 patients. Due to intervention (e.g. Repatha), it drops to 5 per 100 patients. Absolute risk reduction means 5 less patients per 100 having a heart attack (ie. 5% ARR). Relative risk reduction is 50% (5/10 or 50% of the patients). RRR is the number most often used by the media to show the health benefit/risk of a treatment/exposure.
Absolute Risk reduction (ARR)
The proportion of patients that are spared from the adverse outcome as a result of receiving the experimental treatment rather than the control therapy. This number will be significantly lower than the RRR. See above.
Hazard ratio (HR)
It is a measure of how often a particular event happens in one group compared to how often it happens in another group, over a period of time.
For example: The hazard ratio for certain drug is 0.60 that means that the study drug provides 40% relative risk reduction compared to the control group.
Number needed to harm (NNH)
The number of people that are exposed to something that causes harm to one person. E.g. a NNH of 7 means one person is harmed for every 7 people exposed.
Number needed to treat (NTT)
The number of people that are needed to be treated for one of them to benefit compared to the control group. a NNT of 7 means one person is treated for every 7 people exposed.
Confidence interval (CI)
It is a way to describe probability, it describes an estimate to fall between if you redo your test with a certain level of confidence. Usually the 95% confidence interval is used which means you have a 5% chance of being wrong. It usually has lower and upper endpoints. If the CI crosses 0 or 1 then the observation was not significant. For example, the average height of a 16 years old has 95% CI (5’4”, 5’9”). This means that we are confident 95% that their height falls in this range. Another example is say a 95% CI is (0.2-7). This means that it is not a significant result since the confidence interval crosses one.
P- Value
It is used to measure the probability that an observed difference might have occurred by random chance. In medicine it is significant when it is less than 0.05, which means less than 5% chance that a study result was seen based on random chance.
For example, p-value 0.025 means that there is 2.5% chance of the results being random or happened by chance.
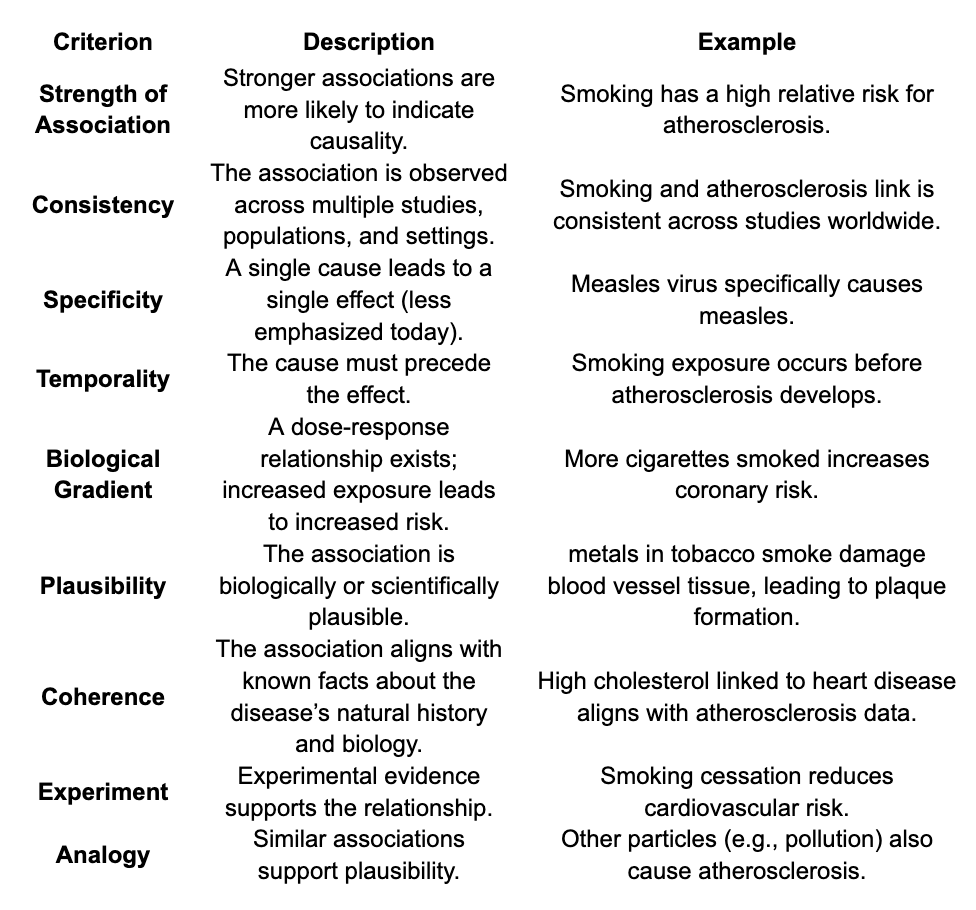
Bradford-Hill Criteria
Set of 9 principles used to determine where a causal relationship exists between a specific factor or exposure eg. Salt and an outcome eg high blood pressure. Use for scientific articles touted in the mainstream media.